Editor’s note: Contributing to this blog post were Timm Sperling, Technical Sales Specialist, Analytical Instruments Group, Dreieich Germany; and Dr. Thomas Stegemann, Sr. Field Application Scientist GC, GC-MS, Dreieich Germany.

Nuts are some of the most prized foods from among nature’s bounty. Nuts are endowed with healthy, polyunsaturated and monounsaturated fats. But what makes nuts so healthy is also what makes them perishable — the unsaturated fats. Nuts have a longer shelf life than our fresh fruits and vegetables, but they are susceptible to rancidity over a period of time. Rancidity takes place when the fat inside nuts becomes oxidized.
Rancidification is the process of complete or incomplete autoxidation or hydrolysis of fats and oils when exposed to air, light, moisture, or bacterial action, producing short-chain aldehydes, ketones and free fatty acids.
For this blog post, fresh walnuts were measured and compared to rancid walnuts that were past their expiration date. The analysis was performed comparing a Thermo Scientific TM ISQ 7610 and a Thermo Scientific Orbitrap™ Exploris.
Which technology can be used to detect rancid off-flavors?
The sample introduction is done using static headspace technology with a Thermo Scientific TriPlus™ 500 Headspace Autosampler on the ISQ 7610 and a Thermo Scientific TriPlus RSH autosampler on the Orbitrap Exploris. Figure 1 shows the different walnut samples in headspace vials.

Figure 1: Walnut samples in headspace vials.
The separation was performed on a Thermo Scientific TRACE™ 1610 gas chromatograph. Detection depends on the amount of sensitivity you would like. For this blog post, an ISQ 7610 was used and an Orbitrap Exploris.

Sample measurements
The goal here was to find relevant substances for fresh and rancid nuts. In addition, a comparison to the Orbitrap Exploris with a 60k resolution was performed. Before every series on both instruments a blank was run. Figure 2 shows the measured samples and the order, there were measured in on the ISQ 7610.
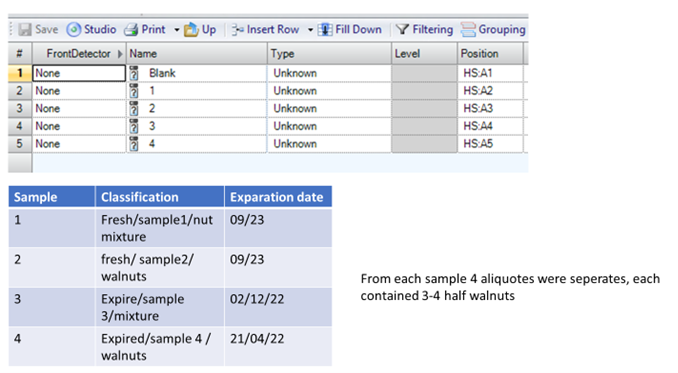
Figure 2: Nut samples.
Figure 3 shows a comparison of all four nut samples in total-ion-chromatogram (TIC) and on the right side a comparison of a fresh sample and an expired sample.

Figure 3: TIC of all samples, blank and fresh/rancid sample.
Already the first glance of the TIC shows the differences of the samples. There are characteristic peaks for fresh, as well as rancid sample. The TIC on the right also visualizes the differences. In the rancid sample, Thermo Scientific Chromeleon™ CDS identified 53 peaks in total via NIST library search. Some examples of off-flavors for rancid are shown in Figure 4. As expected, those were ketones and ketals.

Figure 4: 1=1-Pantanol; 2=Pentanal; 3=Hexanal; 4=2-Octenal.
Figure 5 shows all 53 identified compounds on the ISQ.

Figure 5: NIST library search results.
The same samples were now measured on an Orbitrap Exploris in triplicate. Figure 6 shows the TIC on the Orbitrap Exploris. Using Chromeleon CDS for interpretation of the results, only 19 compounds could be identified.

Figure 6: TIC on the Orbitrap Exploris.
Now with Orbitrap HRMS data, it is possible to use a special software for Deconvolution call Thermo Scientific TM Compound Discoverer (CD). Deconvolution is a key to success to really take a deeper dive into data. In addition, CD allows a statistical evaluation of the data.
Figure 7 shows the CD workflow for the interpretation of off-flavors in walnuts.
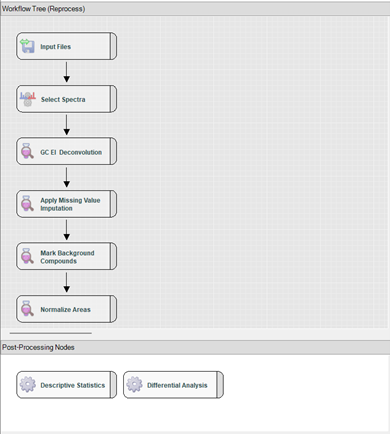
Figure 7: CD workflow.
Figure 8 shows the identification of isopropyl alcohol after deconvolution.

Figure 8: Overlay and identification of isopropyl alcohol.
Since CD allows a statistical comparison of data, the upper left part shows an overlay of all samples. This shows clearly the isoproyl alcohol is only contained in rancid walnuts (orange chromatograms). It was identified with a total score of 96.3 percent. The Orbitrap Exploris shows in general very low delta ppm`s which leads into a high accuracy for the identified compound.
In addition to markers for rancid nuts, there are also markers for fresh nuts. In Figure 9 is an example shown of an overlay, where you can see a marker, that only shows up in fresh nuts.

Figure 9: Marker for fresh nuts 1-Heptene, 5-methyl.
In Figure 10, a principal component analysis (PCA) is shown. Here the total amount of compounds, without background, are shown. This immediately shows the differences for fresh and rancid walnuts.
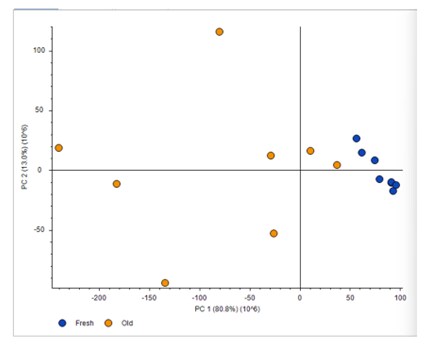
Figure 10: PCA.
A differential analysis is another way to look at the data. Figure 11 shows such a comparison in a volcano plot.
What does a volcano plot show?
- What is inside the squares is relevant
- In the pink field you see the relevant compound for fresh walnuts
- In the green field you see the relevant compounds for rancid walnuts
- The P value describes the statistical relevance
- The Log Fold shows the amount, concentration
- Below the squares, the background is shown
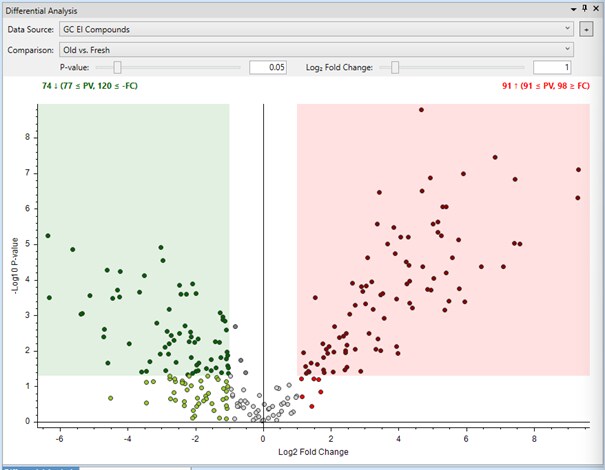
Figure 11: Volcano plot.
Using the Orbitrap Exploris 265 compounds could be identified after deconvolution. This shows the power of HRMS in combination with CD.
Conclusions
As this example shows, GC-MS, in combination with headspace, is the ideal combination to determine rancid off-flavors in walnuts. Also, it is possible to detect markers for fresh walnuts.
Both technologies, single quadruple and HRMS, showed differences in the sample. Depending on the required information and the budget, it can be a good decision to use Orbitrap technology. As the example has shown, in combination with deconvolution, it is possible to generate much more information on an Orbitrap compared to a single quadrupole.
Using the full power of CD, a statistical comparison allows an easy overview of compounds that are considered as rancid off-flavors. This is a fully automated integrated workflow. Hundreds of samples can be compared at the same time. Depending on the depth of statistic that is required, a lot more information can be pulled out of CD. An example with more insights to CD is linked below.
In general, GC-MS delivers proper results to determine off-flavors in all kinds of different matrices.
Related information
Analyte Guru blog: Do all Your Yogurts Taste the Same?
To learn more, attend the on-demand webinar: Off-flavor analysis in food