In my daily work, it increasingly happens that detector settings and parameters no longer get enough attention and importance.
 But before I tell you about best practices of correct data rate with related time constant settings or how the UV detector slit width settings may influence the chromatographic results, I want to highlight a theoretically less complex topic: Signal-to-noise ratio (SNR).
The simple reason is that SNR is key to explain most detector related correlations or interrelations. Best practices for detector settings are sufficiently described in several other resources. You just need to look in the respective detector manual, use the detector wizards or help in the Thermo Scientific™ Chromeleon™ Chromatography Data System (CDS), or search the internet.
Why is SNR the most important data parameter?
In analytical chemistry, the main task is not always the detection and quantification of main components.
Rather, the focus is on the detection of substances such as pollutants, contaminants or degradation products in trace and ultra-trace ranges, for example, in process monitoring or environmental screening analysis. In many of these cases, the sample contains substances of interest in widely different concentration ranges.
If the detected signal of a substance is not sufficiently distinguishable from the unavoidable baseline noise of the analytical method — which means the signal is similar or even smaller — the substance is not detected. This is the fast-track answer to why SNR determines the limit of detection in your LC method.
In quality control, especially in pharmaceutical and biopharmaceutical analysis, impurities must be detected next to main substances such as active pharmaceutical ingredients. Even if detector linearity determines calibration ranges for analytes of interest and, thus, the working area from the lowest to the highest concentration of main substances and impurities, the SNR still defines the limit of detection, in particular, for the impurities.
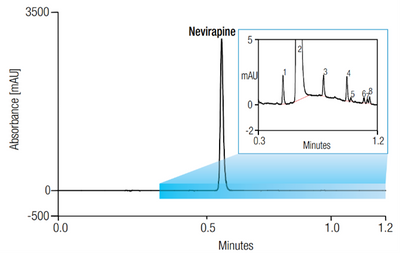
Application Brief 170: Fast Nevirapine Impurity Profiling Using UHPLC-DAD showcases a very good example of lowest SNR combined with the superior linearity range of the Thermo Scientific™ Vanquish™ Diode Array Detector HL. This enables the quantitation of impurities down to 0.008% relative area – in a single run!
If optimization of the analytical method is not possible — which means to either increase the signal of the sample substance or to reduce the baseline noise of the analytical procedure — mathematical methods of signal treatment can be used to smooth out baseline noise.
But you must be clear that raw data is modified – namely artificially processed. There are two ways to do it: during or after data acquisition.
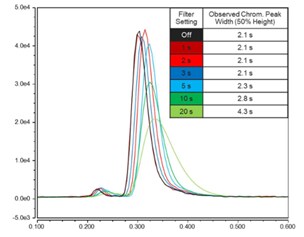
The use of filters like the time constant in UV detectors to smoothing measurement signals is common practice. The time constant (it might be named differently, e.g., response or rise time, which is a factorized time constant) with most detectors is nothing else than an electronic filter that reduces baseline noise.
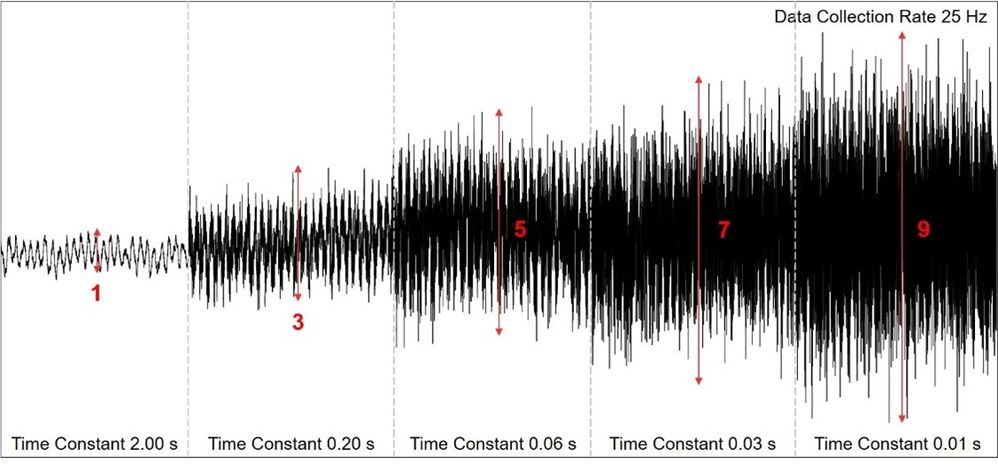
At the same data acquisition rate, different time constants result in varying baseline noise levels. In this case, the baseline noise level increases by a factor of 9 when changing from a time constant of 2.00 to 0.01 seconds. Do you now think that using a time constant of 2.00 seconds is always the best idea because the baseline noise is reduced to a minimum?
Setting the time constant to high values might lead to data loss by over-smoothing. Why?
Particularly smaller substance signals near or in the range of the baseline noise are radically reduced in height (and broadened in width). They are also smoothened out. As a result, substances with lower concentrations might no longer be “detected” after filtering because they now fail the limit of detection criteria (explained later).
 Also, the raw data is acquired with applied time constant filter, which means that this filter cannot be “turned off” or changed after data acquisition to check for smaller peaks.
Thermo Scientific ISQ™ EC and EM single quadrupole mass spectrometers have a chromatography filter function. The filter applies Gaussian smoothing filters to reduce artificial signal variations of detected peaks introduced by electronic or detector noise.
It also removes all signals below a certain threshold, which are considered electronic or detector noise.
Only signals that exceeded this threshold are recorded.
The peak area remains the same (if integration criteria are met).
Are there alternatives that do not lead to possible data loss by over-smoothing?
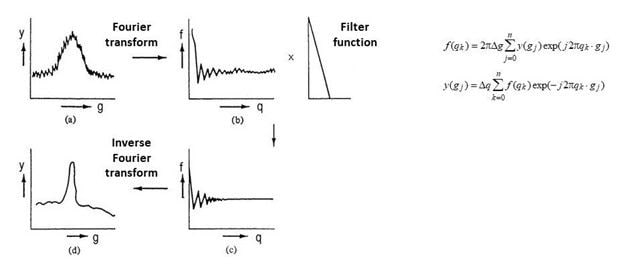
Yes! Gaussian convolution, Savitsky-Golay smoothing, Fourier transform, or wavelet transform are mathematical functions that can be used for subsequent noise reduction. The raw data stays the same (if it is not overwritten or deleted in the calculation process).
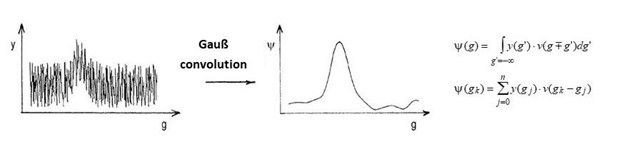
The folding with Gaussian curves has its roots in the autocorrelation analysis, which is used for peak detection in baseline noise, e.g., the qualitative detection of a substance in a ground signal – or better said, in a detector baseline.
Every CDS uses formulas and functions to calculate and visualize results from raw data. For example, Chromeleon software offers intelligent integration using Cobra and SmartPeaks. The Cobra peak detection algorithm simplifies integration and adopts an adaptive Savitsky-Golay smoothing function to remove baseline noise without losing valuable information. The SmartPeaks integration assistant helps to integrate unresolved peaks quickly and intuitively.
Applying Gaussian convolution, Fourier transform, or wavelet transform in a further data evaluation step can be an integral part of any analytical procedure. When used correctly and judiciously, they remove any background noise without data loss.
Fourier transform is applied in several analytical detection techniques ranging from optical like UV-VIS to nuclear magnetic resonance (NMR) spectroscopy. Very prominent is Fourier transform infrared (FTIR), which is used in FTIR spectroscopy, but also in FTIR microscopy.
Did you know that Thermo Scientiic™ Orbitrap™ liquid chromatography mass spectrometers are based on Fourier transform ion cyclotron resonance technology? Fourier transform is used to convert signal frequencies of trapped ions into the actual mass spectrum.
The wavelet transform is seen as a further development of the Fourier transform. In addition to the noise reduction, it can also be successfully used for peak resolution to extract or resolve a smaller substance peak from a bigger peak.
In general, the use of data smoothing should not be overdone.
With high or multiple application, a smoothing factor or smoothing function reduces baseline noise as intended, but the height of the substance signal can also decrease, thereby broadening the signal width. Signals, or rather peaks, can broaden to the point where they merge with the detector baseline, rendering them invisible and undetectable.
However, because the raw data is preserved, you can undo data smoothing steps or apply other filter functions that might lead to a better result. Such a trial could be part of the data evaluation step during the development of a standard operating procedure (SOP).
Whether this over-smoothing effect results in such data corruption depends on signal versus baseline noise height – or initial SNR. With a SNR close to the LOD, the best approach is generally to collect better data, which then requires only one-time or no data smoothing.
Let us now have a closer look at LOD and LOQ.
From SNR to LOD and LOQ
The SNR can serve as a decision measure for estimating whether a substance signal is seen in the detector baseline and, thus, detectable in the sample.
Sensitivity and detection limits of a method are defined by the noise of the measuring system. Noise means all unwanted, statistically fluctuating signals which are superimposed on the measurement signal.
For analytical procedures that show a baseline noise, estimation of the detection (LOD) and quantification (LOQ) limits from the SNR is possible. Typical examples are chromatographic and spectroscopic methods. According to the ICH Quality Guideline Q2(R1) for detection and quantification limit, the LOD and LOQ can be determined based on the SNR and by visual evaluation:
- The LOD is the minimum sample concentration at which the substance signal can be reliably detected when compared to the baseline noise of a blank run. A signal-to-noise between 2:1 and 3:1 is generally considered acceptable for estimating the detection limit. (The next ICH Q2 revision, namely Q2(R2) that is planned to be implemented in May 2023, states in the current draft version: “A signal-to-noise ratio of 3:1 is generally considered acceptable for estimating the detection limit.” Hence, a SNR of 2:1 will not be acceptable anymore in near future.)
- The LOQ is the minimum sample concentration at which the substance signal can be reliably quantified when compared to the baseline noise of a blank run. A typical signal-to-noise ratio is 10:1. (At the time of publishing this blog, no changes for LOQ in ICH Q2(R2) are noted.)
The ICH guideline is implemented by ANVISA in Brazil (RDC 166/2017 and RDC 413/2020), European Committee (CPMP/ICH/381/95), FDA in the United States (Vol. 62, No. 96, p. 27463-7), HAS in Singapore (Analytical Validation Guidelines), Health Canada (15-106599-601), MFDS in the Republic of Korea (Guideline 0213-01), MHLW/PMDA in Japan (PMSB/ELD Notification No. 338), NMPA in China (Announcement No. 7 [2020]), Swissmedic (ICH Guidelines apply in Switzerland automatically), and the TFDA in Chinese Taipei (Guidance for Analytical Validation).
Implementation in additional countries is pending.
SNR, LOD and LOQ in HPLC
Analytical methods are developed with robust parameters, so the results are reproducible even under slightly imperfect analytical conditions—because analytical results must be reliable.
Baseline noise is classified as the difference between the largest and the smallest point of the baseline of a blank run chromatogram. SNR in HPLC is calculated according to the baseline values.
Typically, a peak-free section in the current chromatogram or from a previous blank run is used to determine the baseline noise. This baseline noise (average height) is then compared to the signal height of the substance. That is the magic.
![]()
The detection or quantification limit is given as the number of noise heights that the peak or substance signal must protrude from at least the baseline. It can vary depending on given requirements, typically based on the real-life conditions and circumstances of the analytical method.
In many years of supporting a wide range of customers in all application fields and often in regulated environments, I experienced that minimum SNR for LOD and LOQ are stricter than the ICH guideline, especially with more challenging chromatographic conditions.
As a rule of thumb, I learned these values being the reality with real-life samples and analytical conditions:
- SNR between 3:1 and 10:1 for LOD
- SNR from 10:1 to 20:1 for LOQ
Last words
I hope you can see the SNR is the master guide when talking about how good a data result is.
There are ways to improve SNR, but it might lead to substances at very low concentrations not being detected anymore after data is smoothened to lower down the baseline noise. Smaller substance peaks are flattened until they may no longer be distinguishable from the detector baseline.
Before applying data filters in the analytical method or noise reduction functions, please check if the SNR is sufficient with less or even without data filtering, so you do not lose details of your analytical result.

As shown is this picture, at times, it may not make sense to further improve the SNR.
When looking at the pictures, SNR = 80 might look to be the sharpest picture but with SNR = 20, all details can be seen sufficiently.
Also, with SNR = 80, the street looks like atarroad, but it was actually asandroad. This detail information might be clear(er) with SNR = 20.
With SNR = 8, nobody would say that the road is tarred, and most important details are already sufficiently visible.
Additional Information
Fast Nevirapine Impurity Profiling Using UHPLC-DAD