I particularly enjoy this time of year: Warm evenings, late sunset, the sky illuminated in a wide variety of colors between blue, yellow and red. This fantastic mixture makes me relax and helps me prepare for the next day.
 Interestingly, the analysis of trace elements using inductively coupled plasma optical emission spectroscopy (ICP-OES) is all about colors (or rather the different wavelengths that a particular element emits once vaporized, atomized and excited in the plasma). But the key is to separate one particular wavelength from a wide selection of others to achieve the right result. The blending and mixing of colors, while delightful on a warm summer evening, is not so delightful to the analyst in a busy laboratory.
Those of us in this field are familiar with the challenges associated with ICP-OES analysis; one of the most common being how to recognize and avoid interferences. To achieve this, you have to first establish the type of interference: chemical, physical or spectral.

Figure 1. A spectral interference on Fe 274.932 nm
Figure 1. A spectral interference on Fe 274.932 nm
Chemical interferences occur when there is a difference in the way the sample and the calibration standard react in the plasma, resulting in ionization. These can be easily overcome by the addition of an ionization buffer.
Physical interferences are characterized as differences between the samples and calibration standards that affect the sample transport or nebulization. These differences can be viscosity, density or matrix (from the sample itself or the digestion/preservation procedure). Internal standardization can correct for these differences.
Finally, spectral interferences are characterized by an overlap (either partial or direct) of the analyte of interest by an interfering element. These interferences are normally apparent during method development and can lead to suppression or enhancement of signals, and thus, false negative or positive results. These ultimately degrade the accuracy and precision of the method.
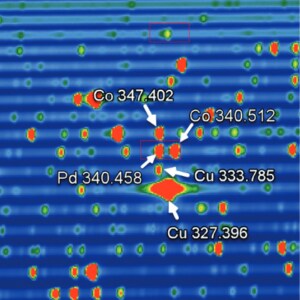
Figure 2. Section of a full-frame exposure using the Thermo ScientificTM iCAPTM PRO Series ICP-OES highlighting the Pd 340.458 nm line, showing full separation from the neighbouring Co 340.512 nm matrix line within the same order, and full separation of matrix lines in adjacent orders (Co 347.402 nm, Cu 333.785 nm and Cu 327.396 nm).
Figure 2. Section of a full-frame exposure using the Thermo Scientific iCAP PRO Series ICP-OES highlighting the Pd 340.458 nm line, showing full separation from the neighbouring Co 340.512 nm matrix line within the same order, and full separation of matrix lines in adjacent orders (Co 347.402 nm, Cu 333.785 nm and Cu 327.396 nm). Spectral interferences can cause the most issues for users, as they are sometimes hard to identify, especially when there is a direct spectral overlap. This results if the interference and analyte wavelengths are separated by less than the solution of the ICP-OES. In this case, the spectrum of the peak may appear slightly asymmetric or have a slight “shoulder,” as shown in Figure 1.
It is normally a requirement of many regulated methods, such as US EPA methods 200.7 or 6010D, to demonstrate that any analysis carried out is free from spectral interferences, typically by running a series of interference check solutions. These solutions contain high concentrations of well-documented interfering elements for key contaminants. When analyzed, these solutions must return a result of close to zero for the analytes of interest. If they do not, an interference is present and corrective action must be taken.
The good news is that modern ICP-OES instruments typically achieve spectral resolution, which allows many of these interferences to be resolved down to baseline. This is true even in samples that produce a complex emission spectrum, such as a mixed platinum group metal solution, as is shown in Figure 2. This allows the users to ensure they have an interference-free analysis.
For some interferences that occur within the resolution of the instrument, corrective action must be taken. Luckily, these are well known and a simple correction known as an inter-element correction (IEC) can be used to ensure no false positives are obtained. This method of correcting unresolvable interferences is accepted as a gold standard and described in many regulated methods. It relies on the use of a simple correction factor that does not change significantly on a daily basis, making it an efficient and robust way of correction for direct spectral overlaps. The effectiveness of an IEC can also be demonstrated and updated as part of a daily workflow by simply running an interference check solution. The Thermo Scientific Qtegra Intelligent Scientific Data Solution Software comes with intuitive features to set up all required IEC equations for a given application, and the tools to execute the required checks and updates within the analysis workflow.
To find out more about the resolving capability of the iCAP PRO Series ICP-OES, please read this technical note. To learn more about the use of IEC corrections and how they can be integrated into your daily workflow, this application note demonstrates accurate analysis according to US EPA 6010D.