Editor’s note: Dr. Susanne Fabel and Ian Acworth contributed to this blog post.
Did you know the charged aerosol detector (CAD) can revolutionize your HPLC analysis by enhancing your workflows?
It’s also my personal favorite LC detector and never ceases to amaze me with the variety of applications. That’s why I wanted to write this blog post, so I could share some of the tips and tricks I’ve learned over the years while using the CAD, allowing you to maximize its potential.
 First let‘s quickly cover what a CAD is for anyone new to this technology:
- The CAD is what we call a near-universal detector, meaning it can detect any non-volatile analyte regardless of whether or not a chromophore is present (key for UV detectors) or if it’s ionizable (essential for MS detection).
- It gives a uniform response for a wide range of non-volatile analytes; this means you can quantify without the need for reference standards.
- With a large dynamic range and sensitivity down to sub nanogram levels, it really is a unique and indispensable detector for any lab.
- You could compare the CAD to other detectors, such as ELSD, but it holds a number of advantages like a wider dynamic range, better sensitivity, and flexible workflows.
Now, here are my top five tips to get the most out of your CAD.
Tip 1 – Use the best quality solvents
First up is your mobile phase. This is probably the most important consideration when using a CAD. If you get this part right, you’ll truly get the most out of your detector.
So, what are these considerations?
- Quality, Quality, Quality. Do I need to say it again? You NEED to use quality mobile phases/solvents. Remember, the CAD can detect any non-volatile compounds, and this includes impurities within the mobile phase.
So, if you use cheap/poor-quality solvents, they will likely have many impurities. Not only will you see a high background with lower sensitivity, but you may even see random peaks that aren’t from your sample (Figure 1).
- Volatility is also an important consideration. The CAD is not a mass spectrometer, but it shares some similarities, one of which is that the mobile phase must be volatile.
The CAD converts the incoming stream into an aerosol, so using something like a phosphate buffer will quickly cause a blockage. Stick to MS-friendly solvents and additives, and you’ll be fine.
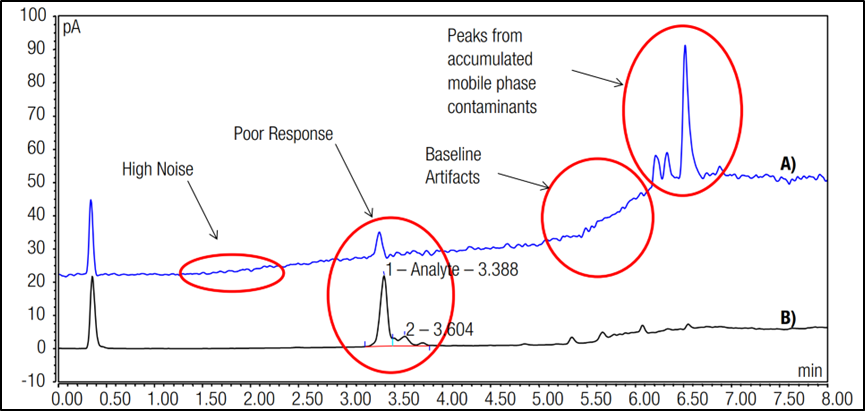
Figure 1. CAD analysis comparing good quality (black) and bad quality (blue) mobile phases.
To get more information on the best practices regarding the mobile phase, please have a look at these top resources:
- Factors influencing charged aerosol detector performance
- Effect of Mobile Phase Quality on Analytical Performance of Corona Charged Aerosol Detectors
Tip 2 – Struggling with sample volatility/sensitivity? Try using a mobile phase additive
My next tip is all about additives. Now, I could have added this to the first tip, but additives deserve their dedicated bit.
Additive is a term that encompasses reagents added to your mobile phases, such as pH modifiers, buffers and ion-pairing reagents. The role of additives is usually to help separation and peak shape, but with the CAD, they can be used for something else.
- The CAD can only detect non-volatiles and some semi-volatiles, so typically, ions such as chloride are too volatile for detection. But using an additive such as an ammonium salt (acetate, formate) would result in the formation of a detectable non-volatile salt (ammonium chloride).
So, if your compound of interest is too volatile for the CAD, using an additive to form a non-volatile salt may enhance the signal. Another example: Figure 2 shows the analysis of oxalic acid with and without triethylamine (TEA).
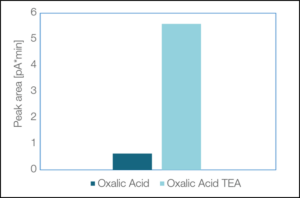
Figure 2. Utilization of salt formation to enhance signal intensity for the semi-volatile compound oxalic acid (0.5 µg each).
You can see how using TEA increases the CAD response five-fold.
But please remember, the same rules that apply to mobile phases apply to additives – they must be volatile, and make sure you use the best quality available.
For more information, you can look at:
- Charged aerosol detection – factors affecting uniform analyte response
- Getting the most out of your charged aerosol detector
Tip 3 – Use an inverse gradient to boost your sensitivity
Now, if you have any experience with CAD, you’ll know one of the big benefits is quantifying unknowns/impurities using a known standard, due to its ability to give a uniform response for all non-volatile compounds. However, you only achieve a uniform response under isocratic conditions.
But if your method utilizes gradient separation, you’ll unlikely achieve a uniform response because the nebulization process (and therefore the detector response) influences the amount of organic solvent entering the detector.
So how can we achieve a uniform response with gradient conditions?
Easy — we use a second pump to generate a second inverse gradient to ensure there is a constant solvent composition entering the detector (Figure 3).
Using a Thermo Scientific™ Vanquish™ Duo UHPLC System for Inverse Gradient will automate the creation of this inverse gradient, making it super simple to set up.
You can watch a video to learn how this works here.
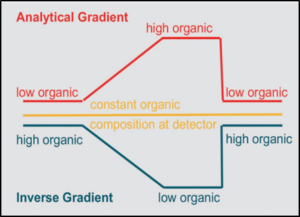
Figure 3. Inverse gradient example.
But interestingly, ensuring a uniform response is not the only function. A little-known benefit is a significantly increased signal response with better S/N and sensitivity of early eluting compounds (Figure 4).
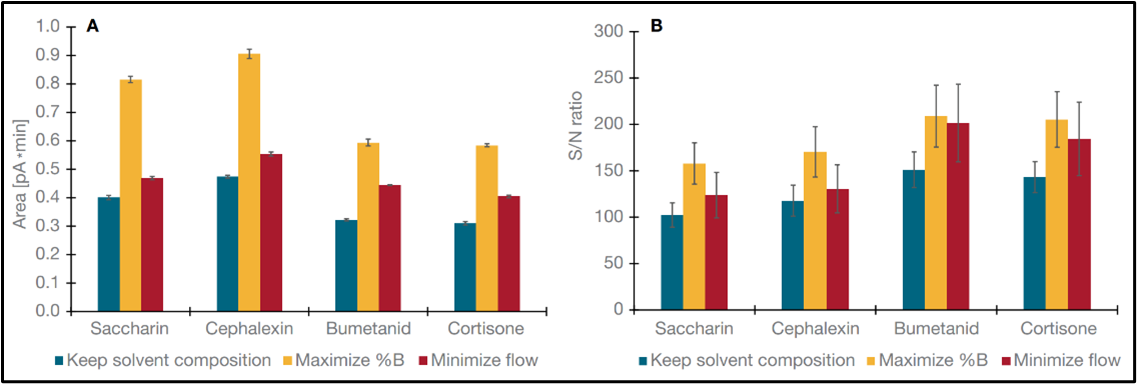
Figure 4. Comparison of different Inverse Gradient modes, where %B is the organic solvent.
Look at the difference in response when you maximize the amount of organic solvent (%B) going into the detector. Not only has it, in some cases, doubled the response, but it has also increased the S/N, so win-win scenario right there.
You can find more information the benefits of inverse gradient here.
Tip 4 – Muscle up your linearity with the Power Function
CAD is a linear or quasi-linear detector over a range of 1.5 to 2 orders of magnitude, but becomes non-linear over a wider range.
But you can use the power function to optimize the range over which the CAD is sufficiently linear for a given application. This is a value that can either be applied in your method or applied post-data acquisition if you use Thermo Scientific™ Chromeleon™ 7 Chromatography Data System (CDS) to process your data.
A common question I get asked is what value to use for linearizing your data. The answer is, it depends on how linear the signal currently is and analyte volatility.
- If your compound of interest is semi-volatile or acts like one, it will most likely produce a supra-linear or sigmoidal response. If this is the case, I would leave it as the default value of 1.0,
- If your compound is non-volatile and produces a sub-linear response, then a value between 1.0 and 1.6 is what I would recommend.
I would recommend you test this experimentally to really optimize this value.
And I can hear you asking what the best way of doing that is? Well, I’m pleased to say we have a handy guide that goes through the details of the Power Function.
Tip 5 – Choose the right column
My final tip is to choose the right column. Again, it’s one of those things that can get overlooked, usually because everyone has a favorite go-to column, right?
But just because it’s great for UV doesn’t mean it will be great for the CAD.
One of the leading causes of high background noise on a CAD is down to column bleed. Column bleed is the introduction of semi- and non-volatile impurities from the column itself.
Here’s how you can choose the right column:
- Have a look at the stationary phase of your column. Column bleed is generally seen in silica-based columns, with HILIC and mixed-mode columns a common example. More modern columns such as the Thermo Scientific™ Acclaim™ Trinity P1 tend to either have special coatings or use a different backbone to alleviate these issues. Column quality also plays a big part of this, so maybe you need to find an equivalent column. You can use our column selector tool to help.
- If you’re not already using a 2.1mm (or smaller) column, see if you can downscale to a smaller column bore size. Due to there being less column surface, you may see less bleed when compared to 4.6mm or greater diameter columns.
- Don’t operate a column close to the temperature or pH limits.
- Avoid using columns exposed to non-volatile buffers or ion-pairing reagents, unless your method uses the ion-pairing reagent, of course.
- Condition a new column with a strong eluent overnight to ensure optimum conditions for your analysis.
So here we are, my best tips for supercharging your CAD analysis.
Let me know in the comments if you found them helpful. I’m confident they will positively impact your workflows.
To find out more information on the benefits of using the CAD, please go to our Learning Center.
And have a look at our searchable publication page to see what industries use the CAD.