1. High Quality RNA
Degraded or impure RNA can limit the efficiency of the RT reaction and reduce yield.  RNA should either be prepared from fresh tissue, or from tissue treated with an RNA stabilization solution such as Invitrogen™ RNAlater® Stabilization Solution. As a result, some degradation of the RNA can be tolerated. If it is not possible to use completely intact RNA, design primers to anneal to an internal region of the gene of interest. Note that for truly quantitative RT-PCR, partially degraded RNA may not give an accurate representation of gene expression.
2. Good Primer and Probe Design
For the most efficient design of primer and probe sets for real-time PCR, we strongly recommend using primer design software. Most primer design programs include adjustable parameters for optimal primer and probe design. These parameters consider primer/probe Tm, complementarity, and secondary structure as well as amplicon size and other important factors. Restricting the number of identical nucleotide runs is also recommended. When designing amplicons in eukaryotic targets, choose PCR primers that span at least one exon-exon junction in the target mRNA to prevent amplification of the target from contaminating genomic DNA.
If you want to avoid the work of designing altogether, choose a predesigned Applied Biosystems™ TaqMan® Assay. Each assay contains everything needed—target primers and an optimized sequence-specific probe—no extra design, optimization or lengthy melt-curve analysis necessary.
3. Use a Master Mix
A master mix, with all the reagents for qPCR mixed together, helps to minimize sample-to-sample and well-to-well variation and improves reproducibility. To further reduce well-to-well variation, use a master mix that contains a reference dye such as ROX. Use this helpful selection guide to choose the right master mix for your experiment (you can even get a free sample).
4. Avoid Cross-Contamination
All surfaces in the PCR area should be routinely decontaminated to prevent cross contamination. Use of a DNA decontamination solution, such as Invitrogen™ DNAzap™ PCR DNA Degradation Solution, which destroys DNA, is recommended. A “No Template Control” (NTC) should be run to rule out cross contamination of reagents and surfaces. The NTC includes all the RT-PCR reagents except
the nucleic acid template. Typically, the DNA or RNA is simply substituted with nuclease-free water. No product should be synthesized in the NTC; if a product is amplified, it indicates that one or more of the RT-PCR reagents is contaminated with the amplicon.
To learn more, read this article on Good Laboratory Practice to Avoid Contamination in your qPCR Experiments.
5. Use “No RT” Control
It is virtually impossible to completely eliminate genomic DNA from RNA preparations. Therefore, it is important to include a minus-reverse transcriptase control (“No Amplification Control” or NAC) in qPCR experiments. Typically, the NAC is a mock reverse transcription containing all the reagents, except the reverse transcriptase. If a product is seen in the NAC, it probably indicates that contaminating DNA is present in the sample.
An easier solution to the problem is to use an assay design that spans an exon-exon junction site. By using this unique sequence that is only present in RNA (or cDNA), genomic DNA will not be detected. When searching for a predesigned TaqMan Assay, you can filter for assays that will not detect genomic DNA.
6. Use an Appropriate Normalization Control
The reliability of any qPCR experiment can be improved by including an invariant endogenous control in the assay to correct for sample to sample variations. The expression level of a good control should not vary across the samples being analyzed. 18S rRNA is often used as a control because it is less variant in expression level than other traditional internal controls such as ß-actin or GAPDH. For more information on choosing an endogenous control, download this application note.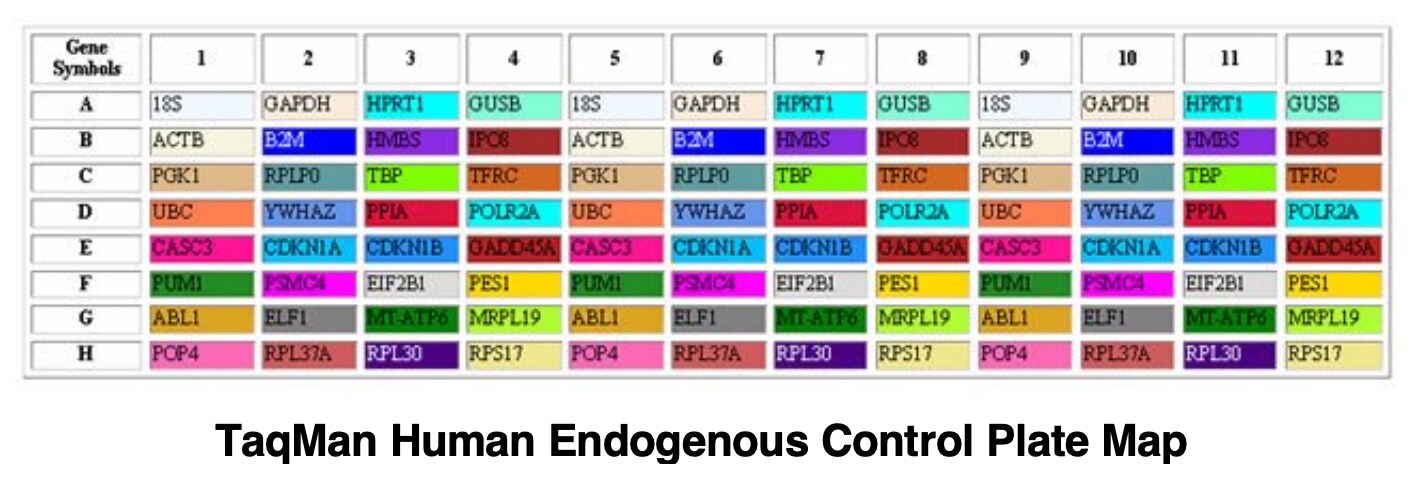
7. Performing Dissociation (Melting) Curves When Using SYBR® Green
Ideally, the experimental samples should yield a sharp peak (first derivative plot) at the melting temperature of the amplicon, whereas the NAC and NTC will not generate significant fluorescent signal. This result indicates that the products are specific, and that SYBR Green I fluorescence is a direct measure of accumulation of the product of interest. If the dissociation curve reveals a series of peaks, it indicates that there is not enough discrimination between specific and non-specific reaction products. To obtain meaningful data, optimization would be necessary.
Avoid the necessity of optimization and melt-curve analysis with TaqMan Assays. Predesigned, probe-based TaqMan Assays are not only optimized for you, they come with a performance guarantee.
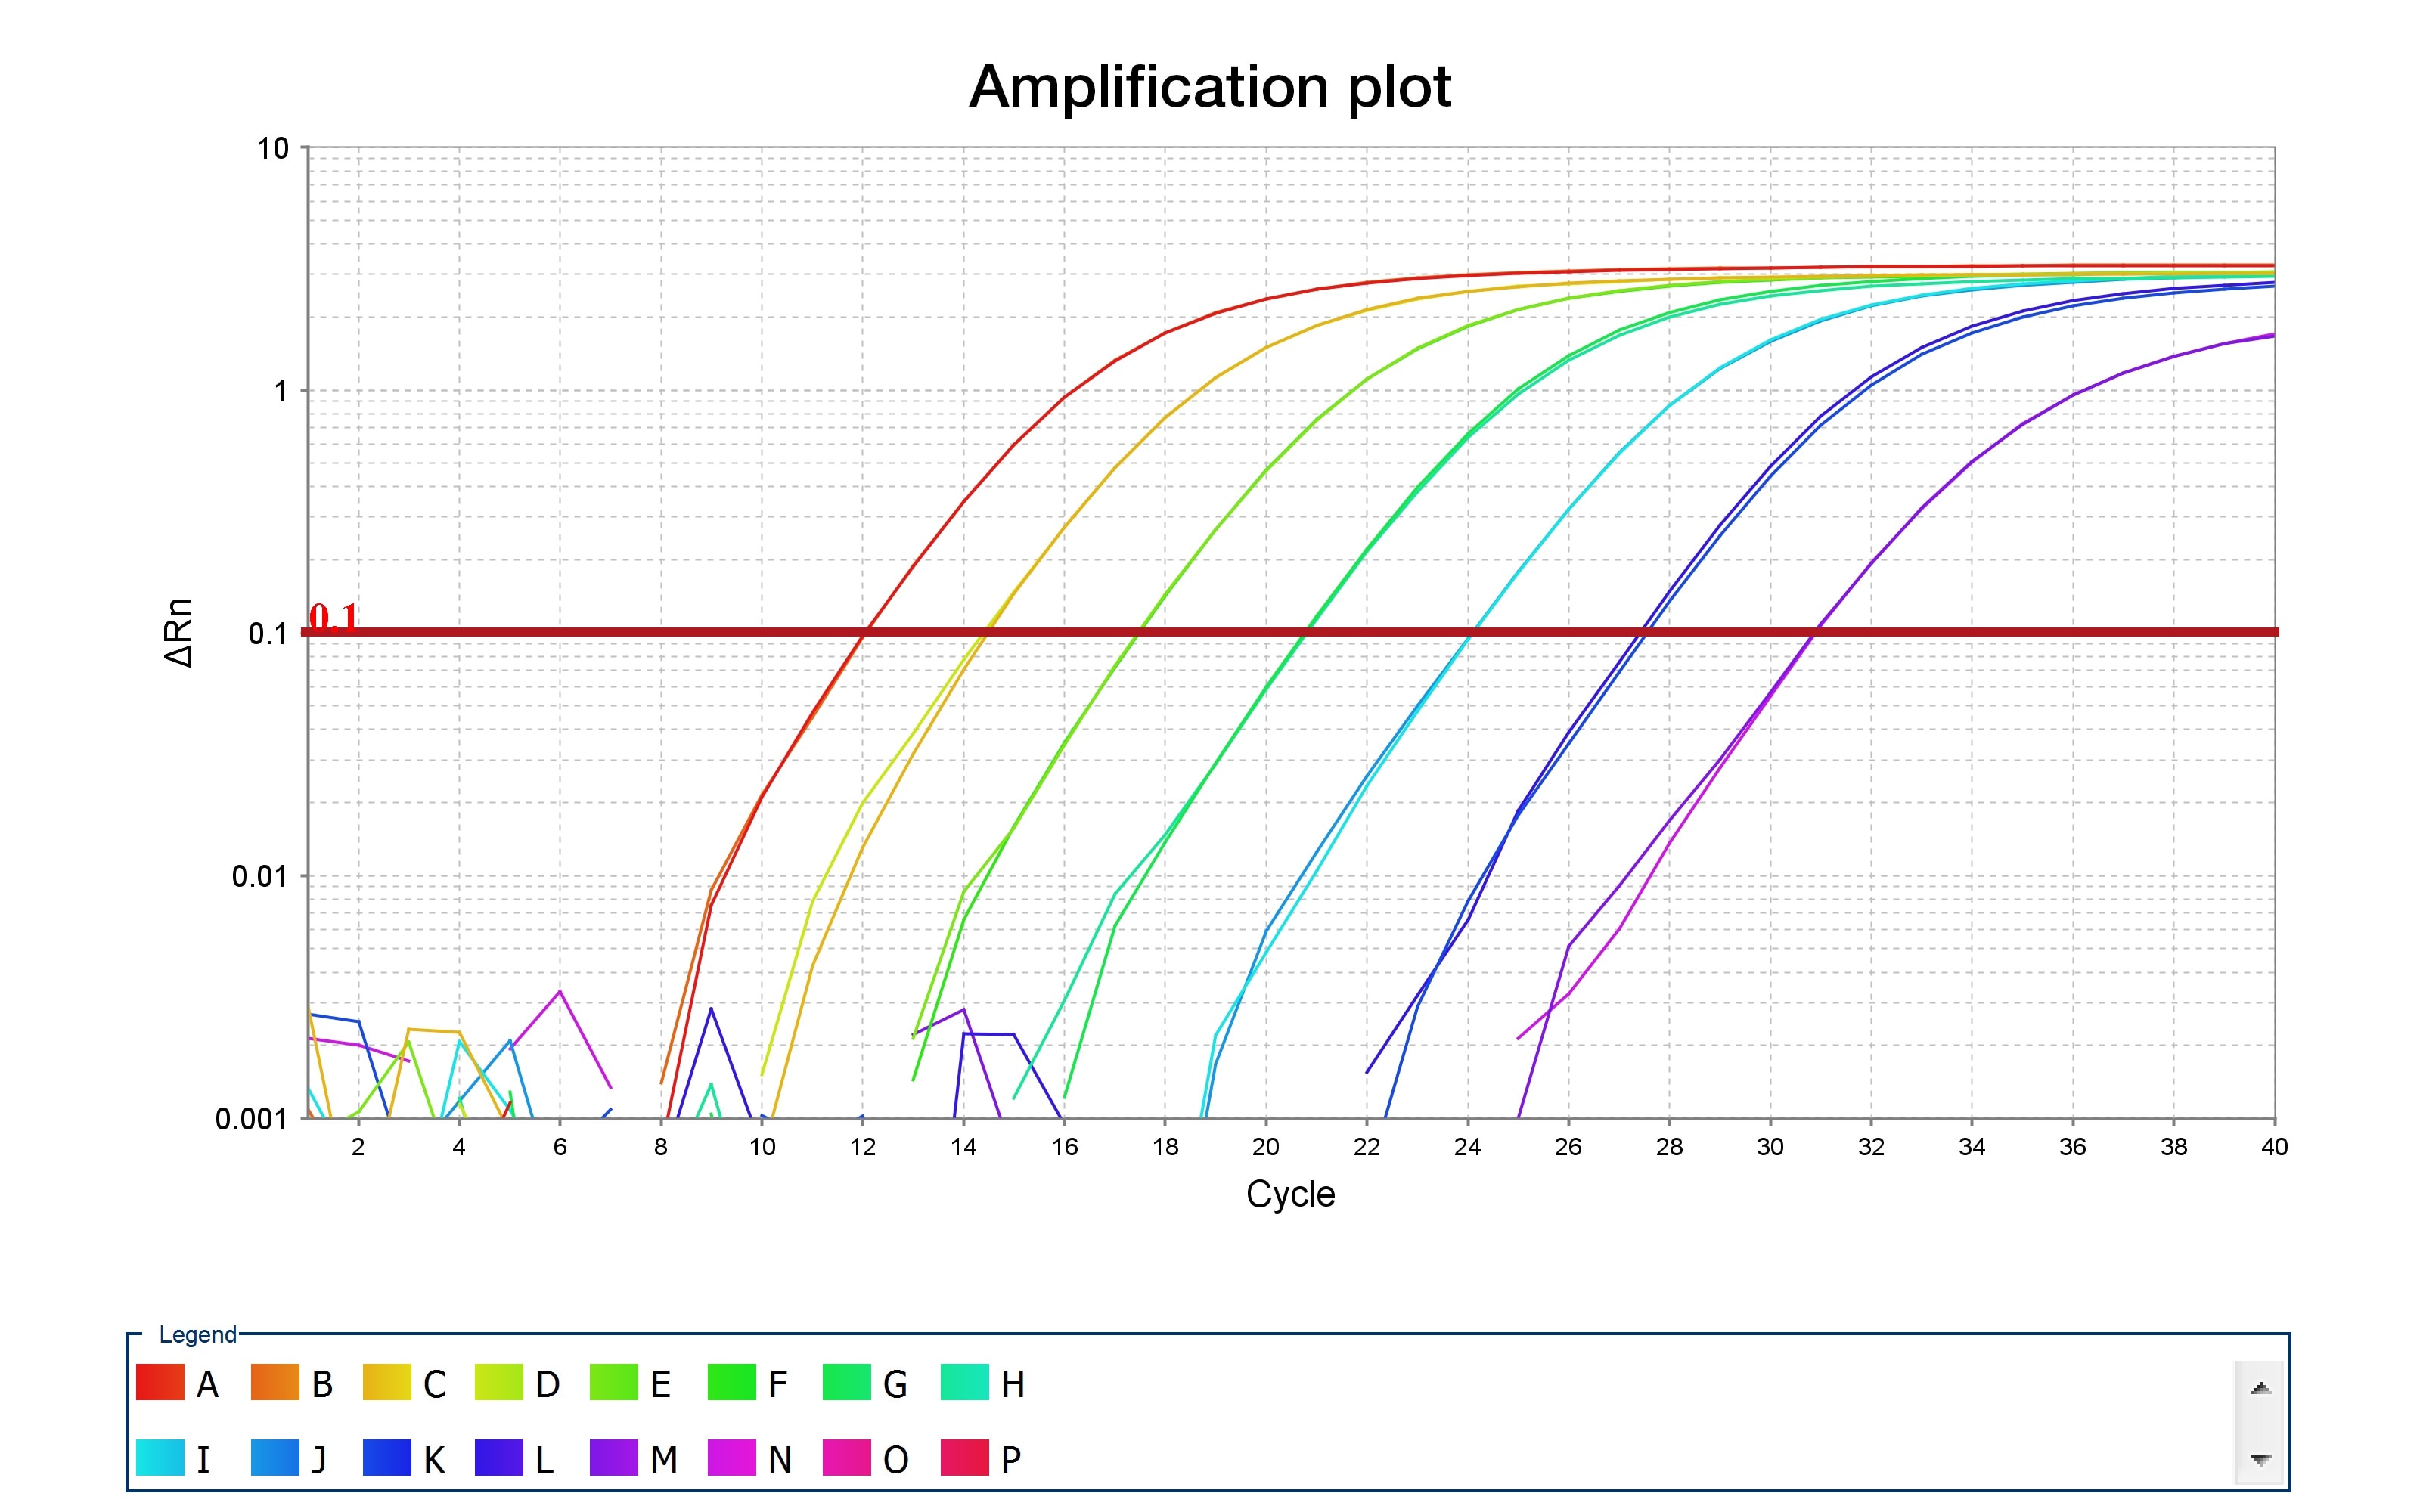
8. Setting the Baseline and Threshold Properly
To obtain accurate Ct values the baseline needs to be set two cycles earlier than the Ct value for the most abundant sample. For real-time PCR data to be meaningful, the threshold should be set when the product is in exponential phase. New Applied Biosystems machines and Thermo Fisher Connect (Cloud) have algorithms that will set baseline and threshold automatically. A new algorithm called Relative Threshold or CRT can be used to determine Cq. Check out the application note, CRT, a Relative Threshold Method for qPCR Data Analysis…, for more information.
Quick Review: The Relative Threshold (Crt) Method.
The figure and steps below describe how the Crt is calculated. 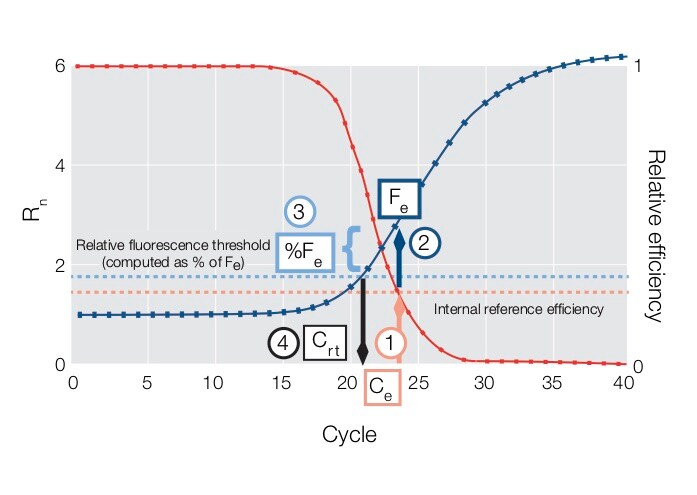 The amplification curve is in blue; the model of the reaction efficiency curve is in red; the y-axis on the left goes with the blue amplification curve, and the y-axis on the right goes with the red curve. Crt is determined
in four steps:
- A predetermined internal reference efficiency level (pink dotted line) is used to identify the fractional cycle (Ce) where the reaction efficiency curve (model) reaches a specific value.
- The fluorescence level (Fe) corresponding to the fractional cycle Ce on the amplification curve is determined.
- The relative fluorescence threshold (light blue dotted line) is a curve specific threshold computed as a specific percentage of Fe (%Fe).
- The Crt is computed as the fractional cycle where the amplification curve crosses the Relative Fluorescence Threshold.
9. Confirming the Efficiency of the Reaction
The efficiency (Eff) of the reaction can be calculated with the following equation:
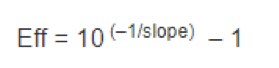
The efficiency of the PCR should be 90–110% (3.6 > slope > 3.1). A number of variables can affect the efficiency of the PCR including length of the amplicon, secondary structure, and primer design, to name a few. Although valid data can be obtained that fall outside of the efficiency range, the qPCR should be further optimized, or alternative amplicons designed.
10. Using an Appropriate Range for Standard Curves
Standard curves should be prepared for each gene under study for RNA quantitation (absolute or relative quantitation), or for verification of the efficiencies of the reactions for comparative quantitation (delta-delta-Ct). The standard curve should extend above and below the expected abundance of your target. Additional input quantities can be included such as the minimum and maximum RNA amounts above and below the limit of detection to help differentiate between specific and non-specific products.
For Research Use Only. Not for use in diagnostic procedures.
Thank you very much for the post. It is very helpful to a beginner who wants to use qPCR technique to track down the microorganisms and viruses in the wastewater samples.