Advancing your digital transformation initiatives from strategy to action requires pragmatic ways to get more from your lab data. For labs using Thermo Scientific™ SampleManager LIMS™ software, the Data Analytics Solution can be a great place to start. The Data Analytics Solution is available to all SampleManager LIMS customers in all industries.
SampleManager LIMS software is helping Thermo Fisher Pharma Services achieve its Pharma 4.0™ vision, with the Data Analytics Solution playing a crucial role in this digital transformation. The Data Analytics Solution in SampleManager LIMS includes a set of out-of-the-box dashboards, providing key business and laboratory insights on resource availability, stock information, location status and lab performance. The dashboards are designed to add context to your lab data, delivering clear insights for informed decisions.
Sarah Watson, Business Analyst, Thermo Fisher Pharma Services, partnered with the Data Analytics Solution design team to expand the offering. The solution includes seven new dashboards:
- Job Status
- Sample Times
- Job Backlog
- Sample Backlog
- Sample Status
- Incidents
- Personnel Test
Watson and the Pharma Services team realized immediate value using the new Sample Times, Job Backlog and Sample Status dashboards. She believes the efficiency and productivity gains the Pharma Services team experienced with these dashboards will benefit other labs, regardless of industry.
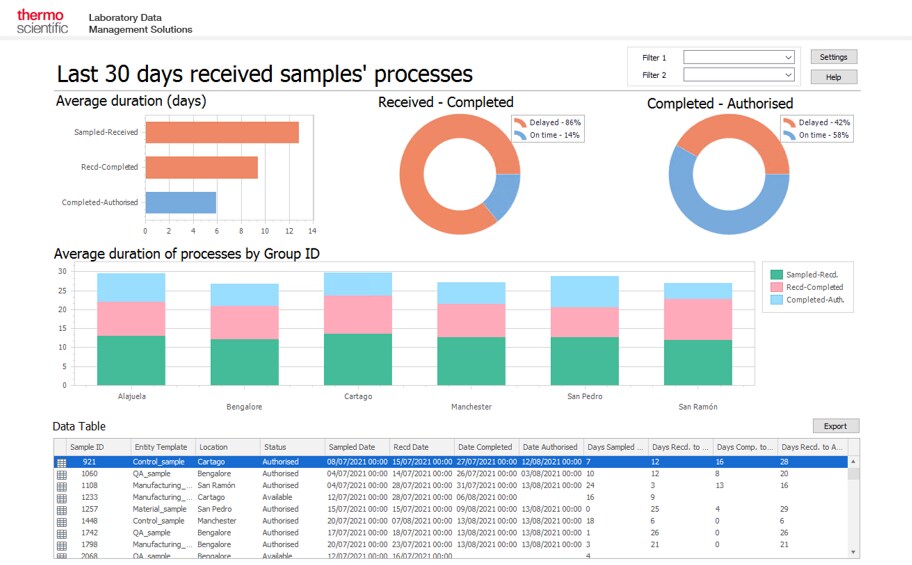
Sample Times Dashboard
The new Sample Times dashboard provides a breakdown of cycle time by laboratory group over the specified number of days (e.g., last 60 days). At a glance, a laboratory manager can determine how efficiently each lab group is functioning. This dashboard provides the data necessary to determine whether lab resource adjustments are needed to meet the manufacturing demand. Knowing the number of samples that the department tested in a quarter aids in planning of both resources and materials.
Watson said having access to this information in real time helps the Pharma Services team understand the laboratory output and constraints. Using the Sample Time dashboard ensures staffing is adequate for routine operations and helps predict bandwidth for upcoming projects and volume fluctuations.
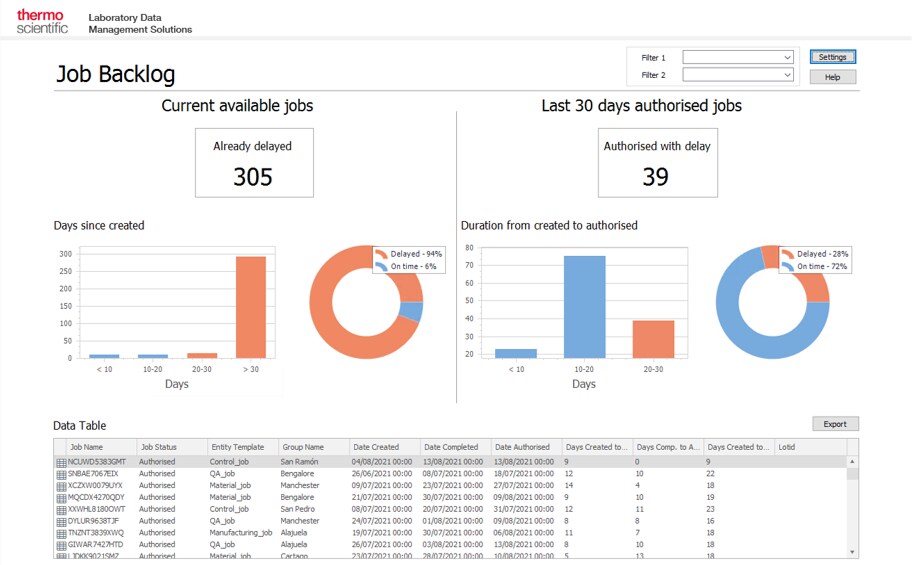
Job Backlog Dashboard
The Job Backlog dashboard highlights jobs where all associated samples and testing have not been completed and authorized by the assigned due date. A job’s due date is set to maintain the product release schedule. Having this information readily available allows for removal of systemic roadblocks and completion of investigations to support on-time product release.
Prior to using the Data Analytics Solution, Pharma Services was using multiple LIMS and other systems for data management. With this setup, only an administrator could obtain job backlog data by running a system query. Watson said the query produced a retrospective view of the data, which didn’t enable personnel to address problems as they happened. “Enabling laboratory personnel to have access to this information in real time will allow for immediate action to release the product consistently, instead of post review investigations into what went wrong,” Watson added.
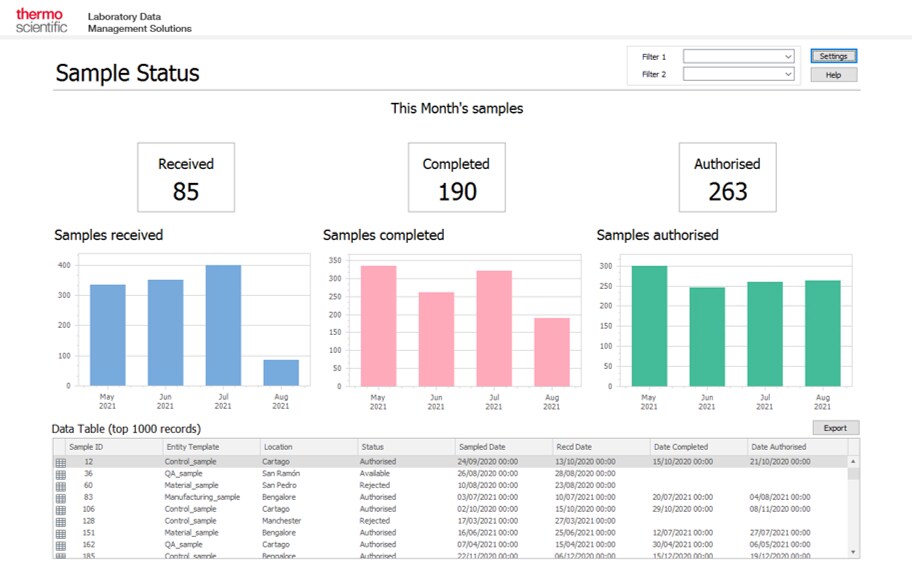
Sample Status Dashboard
The Sample Status dashboard provides a breakdown of the samples within the laboratory and their current status (received, completed or authorized). These metrics showcase the efficiency and predictability of the laboratory while highlighting opportunities for improvement within the laboratory testing and approval process.
For Pharma Services, tracking sample cycle times is critical to understanding laboratory efficiency. “Cycle time is the most used metric across of our labs, globally,” said Watson. Before using the Data Analytics Solution, reports tracking cycle time were very tedious to generate and only provided a retrospective review of performance. “Having the ability to see the cycle time of all samples in the lab in real time will improve the flexibility and response time to support manufacturing when new priority samples are delivered or when testing priorities shift,” Watson continued. She also expects the dashboard to enable faster reaction times when sample testing starts to slip.
From insight to action
Tools like the Data Analytics Solution in SampleManager LIMS software provide a practical way for laboratories across all industries to get more from their data. Want to learn more about the data visualization capabilities available in SampleManager LIMS software? Watch our Orchestrated Lab webinar on advancing data visualization in the lab on-demand or check out the Data Analytics Solutions for SampleManager LIMS software website.
Leave a Reply