 Food industry professionals categorize meats by class (e.g. bird or mammal) and color. For the latter, so-called “red” meat receives that designation from its high myoglobin concentrations. This iron- and oxygen-binding protein persists in muscle tissues used for extended activities and derives its red color from its iron content.
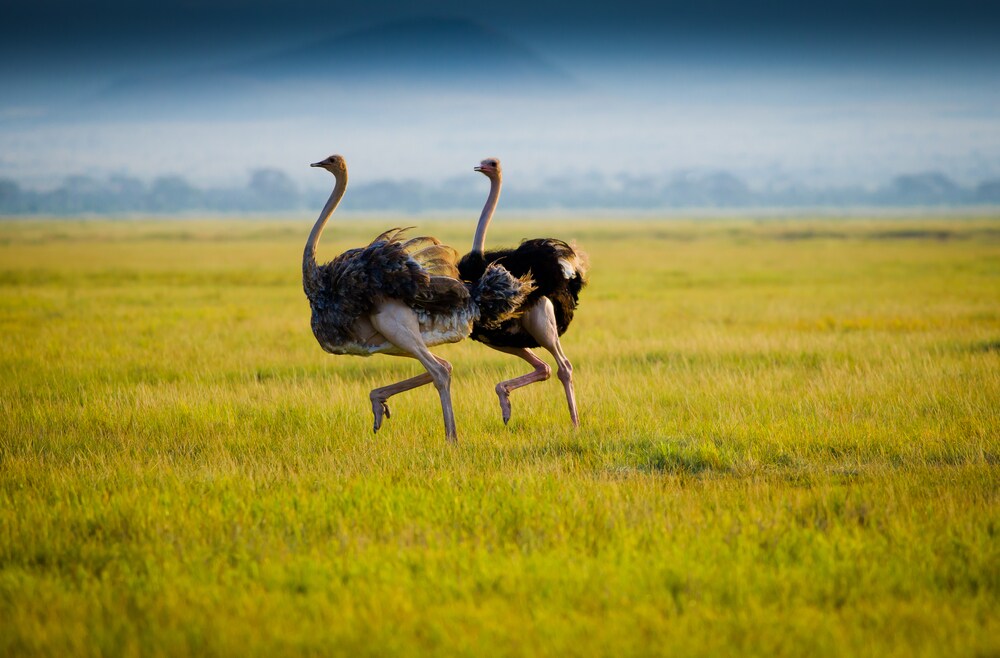
Flightless birds like ostriches, emus, and rheas — collectively referred to as ratites — are more complex to classify. This poultry source presents beef-like pH and the red appearance associated with high myoglobin levels.1 However, it also bears low fat and low cholesterol levels usually associated with white meat.
Ostrich meat in particular is currently trending as an emerging food product presented as suitable for health conscious consumers or foodies with adventurous palates. The most notable nutritional features include fat content, fatty acid profile, fat-to-protein ratio, sodium content, and iron content.2
Fat Content
-
Generally, 1.6% for ostrich meat, 3.8% for turkey,and 4.5% for beef.3
-
When assessed in grams of fat per 100 grams cooked lean meat: 2.8 g fat for ostrich composite, 5.0 g fat for whole chicken, 7.4 g fat for whole turkey, and 9.3g fat for beef composite.3
Fatty Acid Profile
-
Similar fatty acid composition for ostrich, turkey, and beef3
-
Ground ostrich contained 2.84 g saturated fat (per 100 g of meat) compared with 4.335 g for beef.4
Fat to Protein Ratio
-
0.07 for ostrich, 0.18 for turkey, and 0.22 for beef3
Sodium Content
-
When assessed in mg sodium per 100 g of edible meat, 43 mg sodium for ostrich, 63 mg sodium for beef, and 77 mg sodium for chicken.5, 6
Iron Content
-
Specific to cooked lean meat, ostrich contained 3.2 mg iron compared with 1.2 mg iron for chicken, 1.8 mg iron for turkey, and 3.0 mg iron for beef.7
-
Ground ostrich meat contains 5.9 mg iron compared with 4.1 mg iron for ground beef.4
The USDA extended mandatory inspections to ratite producers in 2002, including requiring Hazard Analysis and Critical Control Point (HACCP) systems and sanitation standard operating procedures consistent with poultry regulations. When it comes to food safety precautions, ratite producers can rely on microbiology testing products designed for avian sources, particularly poultry laboratory solutions. These include streamlined detection workflows for foodborne pathogens like Salmonella, Campylobacter, Listeria, and E. coli O157:H7. Since approximately 60% of the 12,000 to 15,000 tons of ostrich meat produced worldwide is sourced in South Africa,2 rendering it a non-local food product for many communities, protocols for sourcing and species validation may also be worthwhile pursuits for producers.
Learn about this and other topics related to food safety and quality testing in our food and beverage community.
References
1 USDA Food Safety and Inspection Service (2013) ‘Food Safety Fact Sheet: Ratites.’ http://www.fsis.usda.gov/wps/portal/fsis/topics/food-safety-education/get-answers/food-safety-fact-sheets/poultry-preparation/ratites-emu-ostrich-and-rhea/ct_index
2 Al-Khalifa, H. and Al-Naser, A. (2014) ‘Ostrich meat: Production, quality parameters, and nutritional comparison to other types of meats.’ The Journal of Applied Poultry Research 23 (4): 784-790.doi: 10.3382/japr.2014-00962
3 Paleari, M. A. et al. (1998) ‘Ostrich meat: Physio-chemical characteristics and comparison with turkey and bovine meat.’ Meat Science 48:205-210.
4 Walter, J. M. et al. (2000) ‘ Ground ostrich: A comparison with ground beef.’ Journal of the American Dietetic Association 100:244-245.
5 Sales, J. (1998) ‘ Fatty acid composition and cholesterol content of different ostrich muscles.’ Meat Science 49:489-492.
6 Cooper, R. G. (1999) ‘Ostrich meat, an important product of the ostrich industry: A Southern African perspective. ‘ World’s Poultry Science Journal 55:389-402.
7 United States Department of Agriculture (USDA). (1975) Handbook No. 8. Nutritional Composition of Foods: Raw, Processed, Prepared. Washington, DC: United State Government Printing Office.


Leave a Reply