 Flare stacks emit excess hydrocarbon gases that cannot be recovered or recycled. These gases combined with steam and/or air are burnt off in the flare system to produce water vapor and carbon dioxide. Increasingly, national and local government bodies are requiring processing companies to monitor the various emissions from their plant stacks and flares to reduce the amount of pollution entering the atmosphere.
The Clean Air Act requires the EPA to regulate hazardous air pollutants, also known as air toxics, from categories of industrial facilities, including petrochemical and organic chemical sectors, among other industries. Analysis of flare gases in order to comply with EPA flare gas rules presents a series of challenges, whether they originate from petrochemical or organic chemical plant stacks.
Emissions are typically made up of complex mixtures of inorganic and organic species, and compositions and concentrations vary dramatically over time as process conditions change. Although many regulations simply require total heating value, total sulfur, or total hydrocarbon values to be recorded, measuring the concentrations of individual components helps identify the source of the emission, locating the problem to a specific part of the plant. Speed of analysis speed is also crucial, as the heating value of the flare can change quickly. Analysis times measured in minutes increase the risk of failing to meet emission standards.
Process Mass Spectrometry is particularly suited to the measurement of both flare and process gas streams in real time because it offers accurate, fast, multicomponent analysis on a single analyzer. Process Mass Spectrometers are gas analyzers based on magnetic sector mass spectrometer technology that provide lab-quality online gas analysis and process analytics.
To verify performance on a refinery flare gas application, we subjected a Process Mass Spectrometer to a factory test on a gravimetric cylinder containing 21 components, including inorganics and hydrocarbons from C1 to C6. The table below shows the cylinder composition, the Process Mass Spectrometer’s quoted performance (standard deviation over 8 hours) and the results obtained from the test. The measured standard deviations for all 21 components were lower than the specified standard deviations over 8 hours.
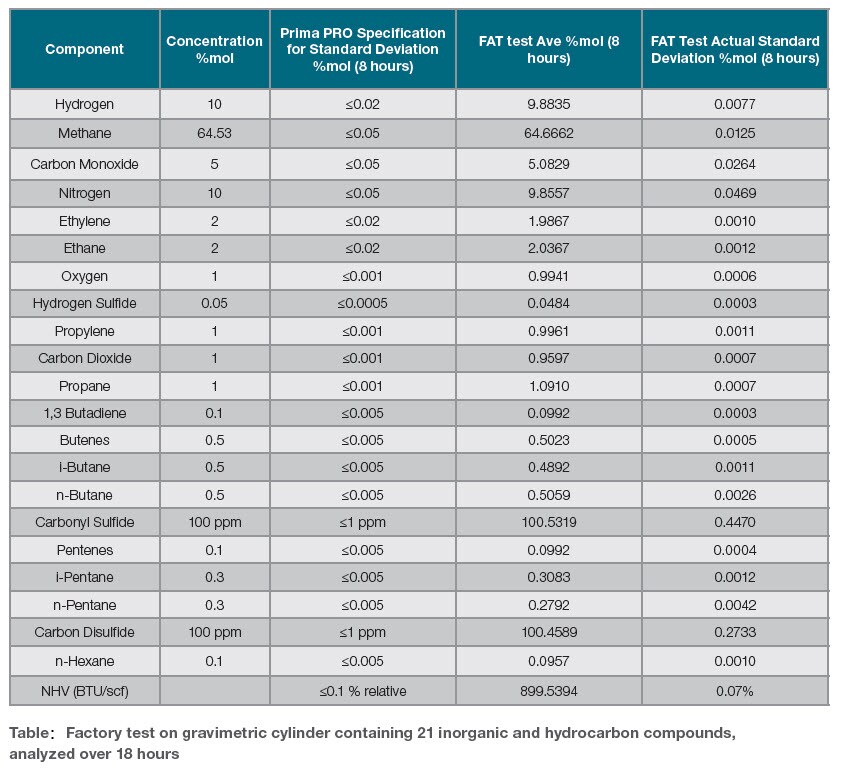
As well as the composition data, the Process Mass Spectrometer calculated the Net Heating Value over the 8 hours of the test; as with the component concentrations, the measured NHV standard deviations are well below the specified 8-hour standard deviations.
View the trend data for major components, minor components, sulfur components and NHV over the 8 hours of the test in the Application Note: Maintain Compliance to Petrochemical (EMACT) and Organic Chemical Sector (MON) Flare Gas Rules with Rapid Online Analysis by Prima PRO Mass Spectrometers
Learn more about fast online monitoring of flare gases:
- Visit our flare stack emission monitoring page
- Download the eBook: What You Need to Know About Flare Gas Emissions, Compliance and Monitoring
- Download the application note Maintain Compliance to Petrochemical (EMACT) and Organic Chemical Sector (MON) Flare Gas Rules with Rapid Online Analysis by Prima PRO Mass Spectrometers

10 Benefits of Raman Analysis for Carbon Capture
Carbon capture is an essential process in the fight against ...
Read More
Integrating Technology to Help Identify Dangerous Gas and Vapor Leaks
Editor’s Note: Our sister blog aimed at the oil and ...
Read More

Leave a Reply