 In our last article, we discussed an experiment we conducted using Energy Dispersive Spectroscopy (EDS) acquisitions to rapidly locate and identify sub-millimeter scale mineral phases in the sample. A thin section of contact metamorphosed Leadville Limestone from Colorado, USA was sectioned, polished, mounted to a glass slide, and finally polished to transparency. It was examined using an X-ray microanalysis system with a fully integrated EDS detector.
Here are the various results from the different mapping techniques that were conducted during the experiment.
Traditional Elemental Mapping
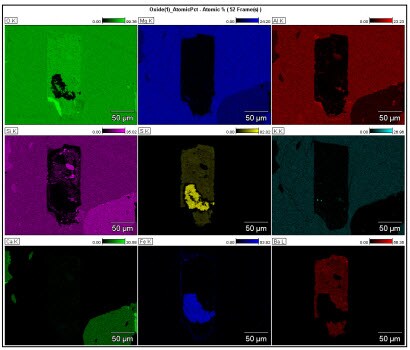
From the peak identification of this spectrum, elemental X-ray count maps can be extracted for display and analysis. The extracted elemental maps show contrast indicative of the existence of different minerals in the sample. Unfortunately, all of the intensity in these count maps was not due solely to the characteristic X-rays of the element of interest but had some contribution from background X-rays in the spectrum. Analysis of these maps could lead to incorrect interpretation if this background intensity is not removed. Quantitative elemental mapping is the method used to display the correct elemental distributions in maps.
Quantitative Elemental Mapping
Quantitative elemental mapping uses the same routines as quantitative spectral processing for composition measurements to convert X-ray counts into meaningful composition values. The needed corrections are background intensity removal, peak deconvolution (for overlapped peaks), and matrix corrections for significant density or X-ray absorption edge effects. One must consider the type of quantification output, e.g., atomic%, the kernel size, and the quality and precision balanced against computation time.
When these corrections are applied to the maps on a pixel-by-pixel basis, the true elemental distributions are observed. For many samples, there may be huge differences in the contrast of many elemental maps. For this sample, the primary change was a slight modification of the background intensities of the maps. However, as an analyst, you are interested in the distribution of the minerals in the sample, not elements. If each mineral had a single unique element, then identification and localization of the corresponding mineral could be performed. But many elements exist in more than one mineral (especially Si, Al, and O) and isolation of unique minerals by single elements is not always possible.
Manual Phase Mapping
A simplistic method of mineral identification is performed when the user selects a set of three elemental maps and overlaps them to look for unique color formation. This technique requires that each elemental map color is changed so that each is a primary color in the color spectrum, i.e., Red, Green, or Blue (RGB).
In this sample the analyst had to select three important elements from the list of nine potential elements, which leads to 84 potential combinations. An example cited using Al, Si, and Fe where each unique color indicated a potential unique mineral. There are unique colors for at least the red, green, and blue colors based on these three elements. But some of the green and blue regions may be combinations of other minerals containing other elements that cannot be included in this simple model. In addition, there are pixels which contain no color at all, meaning that other elemental combinations are required to determine the final solution.
Selection of the best elemental maps for each combination requires much experience and time as there may be many combinations to perform. For simple samples with only a few elements, this technique may have merit. For complex geological analyses with at least six elements, a better technique would be more useful.
Automated Phase Mapping
Collecting a spectrum at every pixel in the sample with Spectral Imaging provides a platform for a multivariate statistical analysis that determines the distribution of the chemical phases across the sample. After analysis and map image extraction, software enables map-spectrum pairs to be displayed. A more visually appealing result is to convert these results into binary phase maps which are then used to extract spectra from the 3D SI histogram. A preliminary step is to automatically assign a mineral name to the results.
Phase results are produced and displayed that are binary colored and labeled with the title from the match spectrum that best fits the phase spectrum. All of the phase maps are automatically overlaid on to the electron image for ease of interpretation. In our experiment, the phase maps collected at 450× magnification revealed six distinct chemical phases; quartz (SiO2), phlogopite (KMg3Si3AlO10(OH)2), diopside (CaMgSi2O6), barite (BaSO4), pyrite (FeS2), and hematite (Fe2O3).
The individual mineral phase maps and associated spectra showed diopside and phlogopite form the calc-silicate matrix of the sample. The barite occurs as an inclusion within a large phlogopite grain. The barite grain also contains an inclusion of pyrite with what appears to be a reaction rim between the pyrite and barite composed of hematite.
A detailed acquisition at a magnification of 4300× concentrating on the pyrite inclusion and barite interface showed the reaction rim more clearly, which indicated that the hematite was growing into the pyrite predominantly from the prior barite-pyrite interface.
You can see a chart of analytical conditions, instruments used, electron images, spectra, and phase maps in the application note: EDS Phase Mapping of a Contact Metamorphosed Calc-Silicate Rock.


Leave a Reply